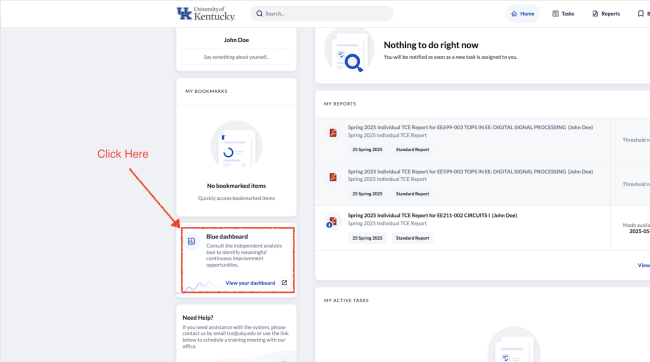
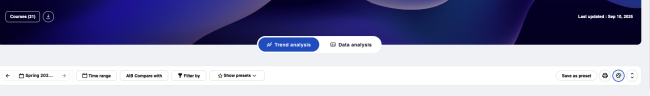
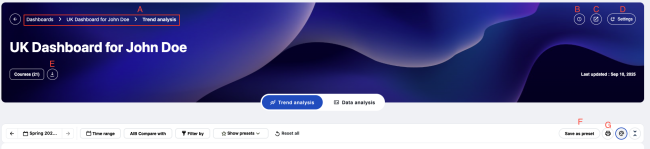
The dashboard offers two primary views, accessible via tabs at the top of the screen.
Trend Analysis View
The Trend Analysis view is the heart of the dashboard. It displays line graphs showing your evaluation scores over time, with separate visualizations for different question groups:
Question Groups Explained
| Question Group |
What It Measures |
| Course Quality |
Single question: "I consider this to be a quality course" |
| Course Questions Overall |
Average of all 6 course-related evaluation questions |
| Instruction Quality |
Single question: "This instructor provided quality teaching" |
| Instructor Questions Overall |
Average of all 7 instructor-related evaluation questions |
Each graph plots your scores across semesters, making it easy to see whether your evaluations are trending upward, holding steady, or showing variation that warrants attention.
Using Trend Analysis
- Adjust the time range: Select which semesters to include in your analysis. You can view up to nine time periods at once.
- Change the anchor period: Use the arrow buttons to shift focus to a specific semester and see detailed data for that period.
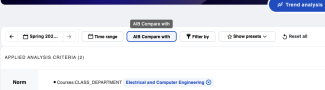
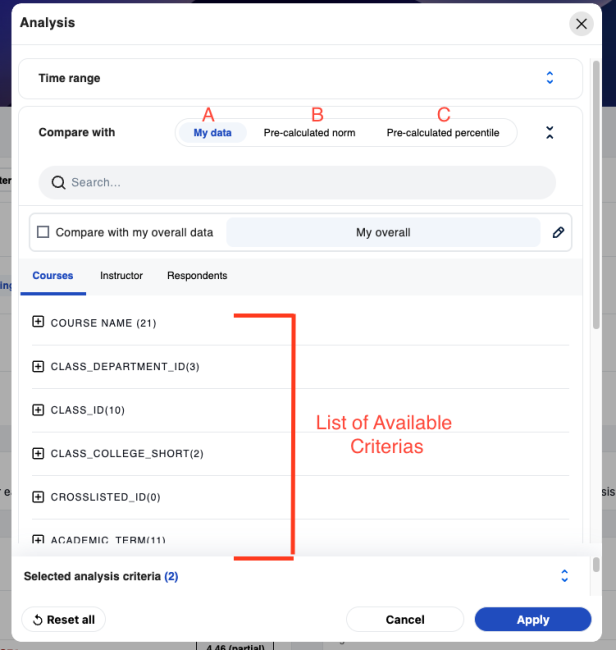
- Filter your data: Narrow results to specific courses, prefixes, or delivery modes to isolate patterns.
Course Sections View
This view provides a detailed breakdown by individual course section, allowing you to examine results at a more granular level than the trend graphs provide.