Skip to main
University-wide Navigation

Getting Started

The TCE Dashboard provides comprehensive analytics for Teacher Course Evaluations, enabling administrators to track and analyze teaching quality and course effectiveness across departments and colleges. The system contains evaluation data from Fall 2017 through Summer 2025.

How to Access the Dashboard

  1. Navigate to Blue at https://evaluate.uky.edu/Blue/
  2. Log in with your LinkBlue credentials
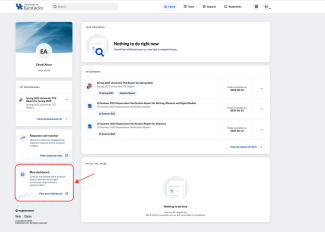
  3. Click 'Dashboard' on the left navigation panel


Where to find Dashboard link

  1. The dashboard will load with your appropriate access level (College or Department)

Key Features

  • Real-time visualization of evaluation scores and trends
  • Comparative analysis across departments, courses, and semesters
  • Downloadable reports and data exports
  • Customizable filters and comparison options
  • Preset configurations for recurring analyses
Access Levels The Aggregate Dashboard is designed for two types of administrative users:

College Administrators

Full access to evaluation data across all departments within their college. Can compare and analyze performance metrics between different departments.

Department Administrators

Access restricted to evaluation data within their specific department and its associated courses. Can analyze course-level performance within the department.

Question Groups The evaluation data is organized into four primary question groups:

Question Group Key Question Description
Course Quality I consider [S$NAME] to be a quality course. Single question measuring overall course quality perception
Course Questions Overall 6 course-related questions Comprehensive course evaluation metrics (excluding open comments)
Instruction Quality [C$FN][C$LN] provided quality teaching. Single question measuring overall teaching quality
Instructor Questions Overall 7 instructor-related questions Comprehensive instructor evaluation metrics (excluding open comments)

Available Filters Customize your analysis using the following filter options:

  • ACADEMIC_TERM - Semester selection
  • CANVAS_SIS_ID - Canvas system identifier
  • CLASS - Course number
  • CLASS_COLLEGE - Full college name
  • CLASS_COLLEGE_SHORT - College abbreviation
  • CLASS_DEPARTMENT - Department name
  • CLASS_DEPARTMENT_ID - Department identifier
  • CLASS_ID - Unique class identifier
  • CROSSLISTED_ID - Cross-listed course ID
  • PREFIX - Course prefix (e.g., BIO, CHEM)
  • SECTION - Course section number
  • DISTANCE_LEARNING - Online course indicator

Tab 1: Summary View The Summary View provides a high-level overview of evaluation performance with the following components:

Score Averages


Summary View Tab

Displays the mean scores for both:

  • Course Quality Score - Average rating for course quality
  • Instructor Quality Score - Average rating for teaching quality

Tip: You can filter by a specific department, prefix, course, or other criteria to view a summary for just those units.

Trend Line Visualization

A graphical representation showing score changes over time, helping identify improvement patterns or areas of concern across semesters.

Ranking Tables

For College Administrators
  • Department rankings for instructor quality
  • Department rankings for course quality
For Department Administrators
  • Course rankings for instructor quality
  • Course rankings for course quality

⚠️ Note: The Summary View supports filtering options but does not include comparison features. Use the Trend Analysis tab for comparative analysis.

Tab 2: Trend Analysis The Trend Analysis tab offers advanced visualization and comparison capabilities through four distinct line graphs, one for each question group.

Key Features

  • Four Line Graphs - Separate visualizations for each question group
  • Advanced Filtering - Apply multiple filters simultaneously
  • A|B Comparison - Compare different departments, courses, or time periods
  • Preset Configurations - Save filter combinations for repeated use
  • PDF Export - Print trend lines as PDF for sharing and reporting

Using the A|B Compare Feature

Example 1: Department Comparison
  1. Click the A|B Compare button
  2. Select CLASS_DEPARTMENT from the options
  3. Choose departments (e.g., Biology vs. Chemistry)
  4. View side-by-side performance trends
Example 2: Online vs. Traditional Courses
  1. Apply filter for DISTANCE_LEARNING = Yes for online courses
  2. Use A|B Compare to add traditional courses
  3. Analyze performance differences across delivery methods